
Reporting and Attribution for Forex Broker, from where to start?
Most forex brokers report paid campaign performance to leadership using whatever metrics happen to be easiest to pull from each platform’s native dashboard — which usually means the wrong metrics, presented to the wrong audience, at the wrong frequency.
A board sees the same dense, platform-native metrics (impressions, CTR, CPC) that the operational marketing team needs daily, while genuinely strategic questions — is our blended customer acquisition cost trending the right direction, is funded account quality holding as we scale — go unanswered because no one built a report structure to answer them at the right altitude for the right audience.
The reporting gap I find most often in forex broker paid media isn’t a missing metric — it’s a CMO presenting cost-per-registration to a CEO who is asking about cost-per-depositing-client, because nobody built the reporting structure around the question leadership actually needs answered.
This guide establishes a tiered reporting structure, explains why standard last-click attribution misleads for forex’s multi-touch path to a funded account, connects reporting to the funded-account-quality and compliance diagnostic principles already established in this series, and closes with a sample reporting template.
Table of Contents
Reporting and Attribution for Forex Broker-The Tiered Reporting Structure — Board, CMO, Operational
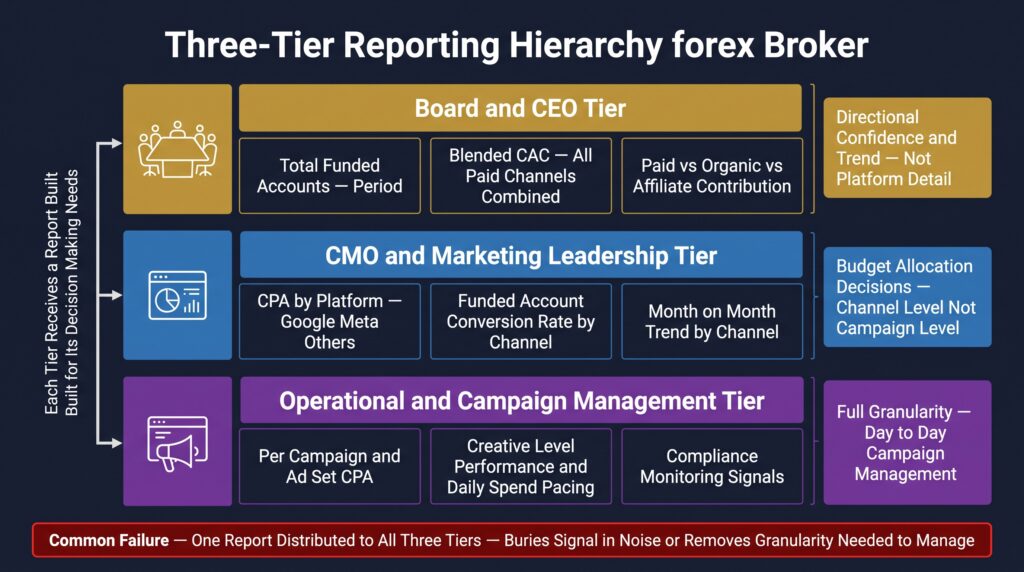
Board/CEO tier: A small number of outcome metrics — total funded accounts for the period, blended customer acquisition cost across all paid channels combined (connecting to the regional benchmarks in the CPA benchmarks guide), and overall paid acquisition’s contribution to total new client volume relative to organic and affiliate channels. This audience needs directional confidence and trend, not platform-level detail.
CMO/marketing leadership tier: Channel-level performance — CPA broken down by platform (Google, Meta, and any others in use), funded account conversion rate by channel, and month-over-month trend by channel. This audience needs enough detail to make budget allocation decisions across channels without needing platform-login-level granularity.
Operational/campaign management tier: Full granularity — per-campaign and per-ad-set CPA, creative-level performance, daily spend pacing, and the compliance monitoring signals covered later in this guide. This audience needs the detail required to actually manage campaigns day to day.
The common failure mode: Presenting board-level audiences with operational-level detail buries the strategic signal in noise; presenting operational teams with only board-level summaries leaves them without the granularity needed to actually manage performance. Each tier should receive a report built specifically for its decision-making needs, not a single report distributed identically to all three audiences.
Why Last-Click Attribution Misleads for Forex Specifically
A forex prospect’s path to a funded account frequently spans multiple channels and a meaningful time gap — initial discovery via organic content, first paid contact via search, nurture via retargeting (per the retargeting strategy guide) and email (per the email sequences guide), with the final converting touch sometimes occurring on a completely different channel than the one that generated initial awareness.
The systematic distortion: Last-click attribution credits the entire conversion to whatever channel happened to be active closest to the funding moment — typically retargeting or branded search, since these are naturally positioned at the end of the funnel. This systematically under-credits top-of-funnel channels (brand awareness content, potentially TikTok per the TikTok viability guide) that generated the initial interest, even though removing that top-of-funnel touch entirely might mean the bottom-funnel retargeting never had an audience to convert in the first place.
The practical implication: A broker relying exclusively on last-click attribution risks systematically defunding the top-of-funnel channels that are actually generating the demand the bottom-funnel channels convert, simply because the reporting structure can’t see their contribution. A multi-touch or position-based attribution model — giving partial credit to multiple touchpoints along the path rather than 100% credit to the last one — produces a more accurate picture, even though it requires more sophisticated tracking infrastructure to implement.
The Funded-Account-Quality Dimension — Volume Alone Misleads
Per the principle established in the CPA benchmarks guide, any reporting structure should track funded account quality — average initial deposit size, early-stage retention rate — alongside raw funded account volume, not volume in isolation.
Why this matters for the report specifically, not just the underlying strategy: A report showing rising funded account count month over month looks like unambiguous good news to a board or CMO glancing at a single headline number. If that rising volume is accompanied by declining average deposit size and declining early retention — meaning the channel mix has shifted toward lower-quality client acquisition — the report’s headline number is actively misleading without the quality dimension presented alongside it.
The practical structure: Every tier of the reporting structure, but especially the board and CMO tiers, should present funded account volume and quality as a paired metric, never volume alone — a simple two-column presentation (funded accounts this period / average deposit and 30-day retention this period) prevents a leadership audience from approving a budget increase toward a channel that is quietly degrading in client quality even as its volume numbers look increasingly attractive.
Cross-Platform Consolidation — The Practical Tooling Question
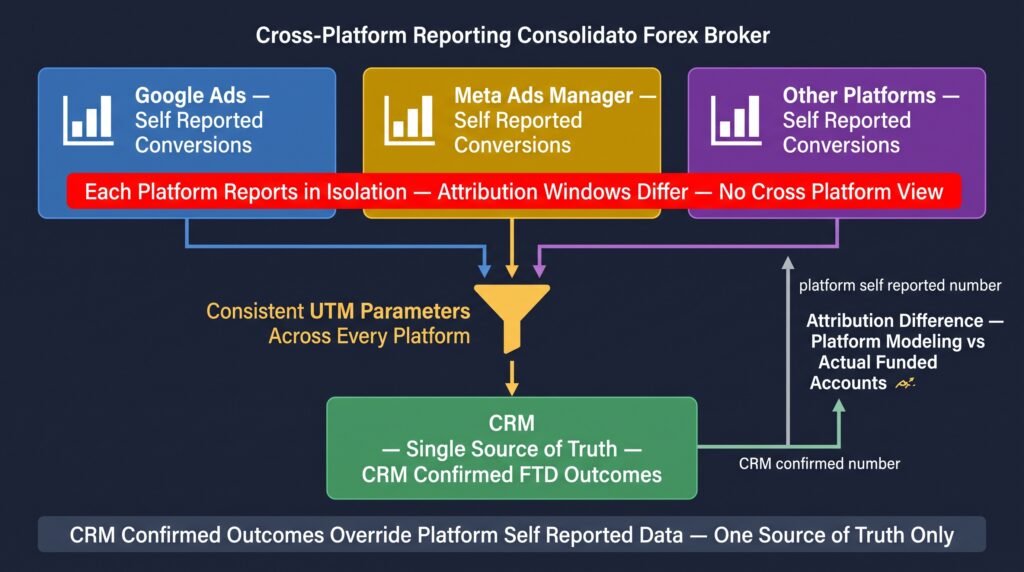
Each platform’s native reporting interface — Google Ads, Meta Ads Manager, and any others in the broker’s channel mix — presents its own metrics in isolation, with no native cross-platform view connecting spend on each platform to the same funded-account outcome ultimately tracked in the broker’s CRM.
The minimum viable approach: A consistent UTM parameter and conversion tracking discipline applied uniformly across every platform, feeding into a single source of truth — typically the broker’s CRM — rather than relying on each platform’s self-reported conversion data independently, which can differ meaningfully from actual CRM-confirmed outcomes due to attribution window differences and platform-side conversion modeling.
The full technical implementation of cross-platform tracking infrastructure — including the specific tools, postback configuration, and the compliance considerations around redirect and tracking technology — deserves its own dedicated treatment given the depth involved, and is covered separately in this content series. This guide establishes what the resulting reporting structure should look like once that tracking foundation is in place.
Reporting Cadence — What Gets Reviewed Daily vs Monthly
Daily or near-daily cadence (operational tier): Spend pacing against budget, CPA trend at the campaign level, and ad rejection or account health monitoring per the suspension prevention framework in the account suspension guide. These metrics need fast response time if something goes wrong.
Monthly cadence (CMO tier): Channel-level CPA and funded account conversion trend, paired volume and quality metrics, and budget allocation review across channels. Monthly smooths out short-term noise while still allowing timely course correction.
Quarterly cadence (board tier): Blended CAC trend, overall paid acquisition contribution to new client volume, and directional strategic questions (should the channel mix shift, is a new platform like TikTok worth testing per the TikTok viability guide). This audience needs trend and direction, not response to short-term fluctuation.
The principle behind cadence matching: Reporting every metric at every cadence to every audience creates noise that obscures genuinely actionable signals — a board reviewing daily CPA fluctuation is distracted from the strategic question that cadence is meant to answer, while an operational team waiting for a monthly report to catch a spend pacing problem responds too slowly to prevent budget waste.
Building the Compliance Diagnostic Into the Reporting Structure Itself
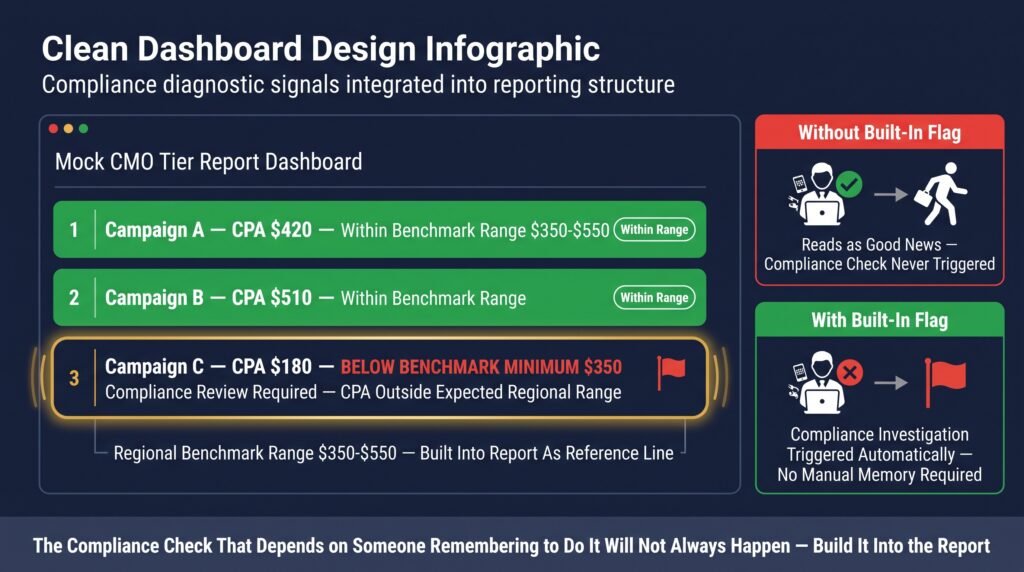
Per the diagnostic principle established in the paid ads diagnostic guide, a CPA significantly below the relevant regional benchmark is a compliance investigation trigger, not simply a performance metric to celebrate. This insight is only operationally useful if the reporting structure itself surfaces it automatically.
WHY THIS NEEDS TO BE BUILT IN, NOT LEFT AS A MANUAL CHECK
A busy marketing team reviewing a dashboard showing strong CPA performance has every incentive to read that number as good news and move on, especially under time pressure. If the report itself doesn’t flag “this CPA is meaningfully below the expected regional benchmark” as a distinct, visually marked signal, the compliance investigation this benchmark comparison is supposed to trigger simply doesn’t happen — not because anyone decided to skip it, but because nobody was prompted to make the comparison in the moment.
The practical structure: Build the regional CPA benchmark range directly into the operational and CMO-tier reports as a reference line or flag, so any campaign performing significantly outside that expected range is visually distinct on the report itself, prompting the same compliance review described in the diagnostic guide automatically rather than depending on someone remembering to check separately.
FOR CEOS — THE ONE QUESTION TO ASK
Ask whether your current dashboard would visually flag a campaign performing suspiciously below the expected cost benchmark for its region, or whether someone would need to notice and manually check this themselves. If it’s the latter, your reporting structure isn’t actually serving the compliance function it should.
A Sample Reporting Template Structure
A consolidated reference structure organizing every metric discussed in this guide by audience tier and cadence:
| Tier & Cadence | Metrics Included |
|---|---|
| Board / CEO Quarterly | Total funded accounts + QoQ trend; blended CAC across channels + trend; paid acquisition’s share of total new client volume; brief qualitative context on channel mix shifts |
| CMO / Marketing Leadership Monthly | CPA by channel with benchmark comparison flagged; funded account conversion rate by channel; paired volume + quality metrics (avg. deposit, 30-day retention); MoM trend by channel; compliance flags requiring review |
| Operational Daily / Ongoing | Spend pacing vs. budget by campaign; campaign/ad-set CPA with benchmark flagging; ad rejection + account health status; creative-level performance for active tests |
This structure is a starting framework, not a rigid template — adapt the specific metrics and presentation to your platform mix, CRM capabilities, and organizational reporting culture, but keep the underlying tiered logic consistent.
If you want this reporting structure built specifically around your current platforms, CRM, and reporting cadence to leadership, that build is part of the diagnostic.
FAQ
Q1: What metrics should a forex broker report to leadership about paid campaign performance?
Leadership-level reporting for forex broker paid campaigns should focus on a small number of outcome metrics rather than platform-level operational detail. At the board or CEO level, this means total funded trading accounts for the reporting period, blended customer acquisition cost across all paid channels combined, and paid acquisition’s overall contribution to total new client volume relative to organic and affiliate channels, reviewed quarterly with directional trend. At the marketing leadership level, more detail is appropriate: cost per acquisition broken down by individual platform, funded account conversion rate by channel, and month-over-month trend by channel, reviewed monthly. Presenting board-level audiences with campaign-level operational detail buries the strategic signal in unnecessary noise, while operational teams need far more granularity than either leadership tier requires to actually manage day-to-day campaign performance.
Q2: Why does last-click attribution mislead for forex broker marketing?
Last-click attribution misleads for forex broker marketing because a prospect’s path to a funded trading account frequently spans multiple channels and a meaningful time gap, including initial discovery through organic content, first paid contact, nurture through retargeting and email, with the final converting touch often occurring on a different channel than the one that generated initial awareness. Last-click attribution credits the entire conversion to whichever channel was active closest to the funding moment, typically retargeting or branded search, which systematically under-credits top-of-funnel channels that generated the original interest, even though removing that initial touch might mean the bottom-funnel channel would have had no audience to convert at all. This distortion risks defunding the very channels generating demand that other channels ultimately convert, simply because a last-click reporting structure cannot see their actual contribution to the outcome.
Q3: Should forex broker reporting track funded account quality, not just volume?
Yes. Reporting that tracks only the volume of newly funded trading accounts without also tracking funded account quality, such as average initial deposit size and early-stage client retention, can present a misleading picture of marketing performance. A report showing rising funded account volume month over month appears to be unambiguous good news at a glance, but if that rising volume is accompanied by declining average deposit size and declining early retention, the underlying channel mix may have shifted toward lower-quality client acquisition even as the headline volume number looks increasingly attractive. Every reporting tier, particularly those reviewed by leadership, should present funded account volume and funded account quality as a paired metric rather than volume alone, preventing a leadership audience from approving increased budget toward a channel that is quietly degrading in client quality.
Q4: How often should different forex broker marketing metrics be reviewed?
Different forex broker marketing metrics warrant different review cadences matched to their audience and decision-making purpose. Operational metrics, including daily spend pacing against budget, campaign-level cost trends, and advertising account health monitoring, warrant daily or near-daily review since they require fast response if something goes wrong. Marketing leadership metrics, including channel-level acquisition cost and conversion trends paired with funded account quality, are better reviewed monthly, which smooths short-term noise while still allowing timely course correction. Board or executive-level metrics, including blended customer acquisition cost trend and overall paid acquisition contribution to new client growth, are appropriately reviewed quarterly, since this audience needs directional confidence rather than reaction to short-term fluctuation. Reviewing every metric at every cadence for every audience creates reporting noise that obscures the genuinely actionable signals each audience actually needs.
Q5: Can a marketing dashboard help catch compliance issues for forex brokers?
Yes. A direct paid acquisition cost significantly below the expected benchmark for a given region is a signal worth investigating for potential compliance issues, such as non-compliant creative attracting low-intent traffic or geographic targeting errors, rather than being treated purely as a positive performance result. This diagnostic principle is only operationally useful if the reporting structure itself surfaces the signal automatically, since a busy marketing team reviewing a dashboard showing strong cost performance has every incentive to interpret that as good news without separately checking it against a regional benchmark. Building the expected cost benchmark range directly into operational and leadership-level reports as a visual reference or flag ensures that any campaign performing significantly outside the expected range is immediately visible on the report itself, prompting compliance review automatically rather than depending on someone remembering to make the comparison separately.
Q6: What does a complete forex broker paid campaign reporting structure look like?
A complete reporting structure for forex broker paid campaigns organizes metrics into three tiers matched to audience and cadence. A quarterly board report includes total funded accounts and quarter-over-quarter trend, blended customer acquisition cost across channels, and paid acquisition’s share of total new client volume, with brief qualitative context on significant channel shifts. A monthly marketing leadership report includes cost per acquisition by channel with benchmark comparison flagged, funded account conversion rate by channel, paired funded account volume and quality metrics, and notable compliance flags requiring review. A continuously updated operational dashboard includes spend pacing against budget by campaign, campaign and ad-set level cost performance with benchmark flagging, advertising account health status, and creative-level performance for active tests. This tiered structure should be adapted to the specific broker’s platforms and tools while maintaining the underlying logic of matching metric depth and frequency to each audience’s actual decision-making needs.