
Forex Broker CPA Ranges, what we cane expect?
When marketing teams discuss forex broker CPA, they are usually talking about one of two very different numbers — and conflating them produces budget planning that is wrong by a wide margin.
Affiliate payout CPA is what a broker pays a partner for each qualified, funded client referred — a figure brokers publish competitively to attract affiliates and IBs. Direct paid acquisition CPA is what the broker itself spends on Google, Meta, or other platforms per client acquired through its own campaigns — a figure brokers almost never disclose publicly. Most content discussing “forex CPA” online addresses only the first concept. This article addresses the second, using the first as an evidenced, transparent benchmark proxy.
The variable that most distorts CPA comparisons in forex broker budget conversations is minimum deposit requirement — a broker with a $100 minimum and a broker with a $500 minimum are not acquiring the same client, and their cost-per-FTD figures cannot be meaningfully compared, but they almost always are.
This guide covers why CPA varies so dramatically by region (the $150 to $1,500+ range), what drives that variance, how to use CPA as a compliance diagnostic signal, platform-specific variance within regions, and how to apply this benchmark practically in budget planning.
Table of Contents
Why Affiliate CPA Data Is a Useful (If Imperfect) Proxy
A broker’s affiliate CPA is not bounded by the deposit amount — it is bounded by client lifetime value. A client who qualifies at the $200 deposit tier and trades actively for 12 months generates spread revenue that can be multiples of that deposit. Published affiliate CPA rates reflect this — Exness pays $600 CPA for a $200-minimum-deposit client in the UAE, and $1,850 for a $600-minimum client. The deposit threshold is the qualifier for the payout tier, not the ceiling for what the client is worth. This is why affiliate CPA data is a useful proxy for understanding regional acquisition value — but why it must be read against LTV, not against the deposit figure alone.”
Source Exness available August 2026
A note on the data: The benchmark figures throughout this article are derived from publicly available affiliate program marketing materials, which have some inherent incentive toward presenting competitive, attractive figures. Treat these as directional ranges and patterns, not as precise, audited direct-spend data. The actual figure for any specific broker, creative quality, and campaign sophistication will vary around these ranges.
The Tier 1/2/3 Regional Breakdown — And Why Each Tier Costs What It Costs
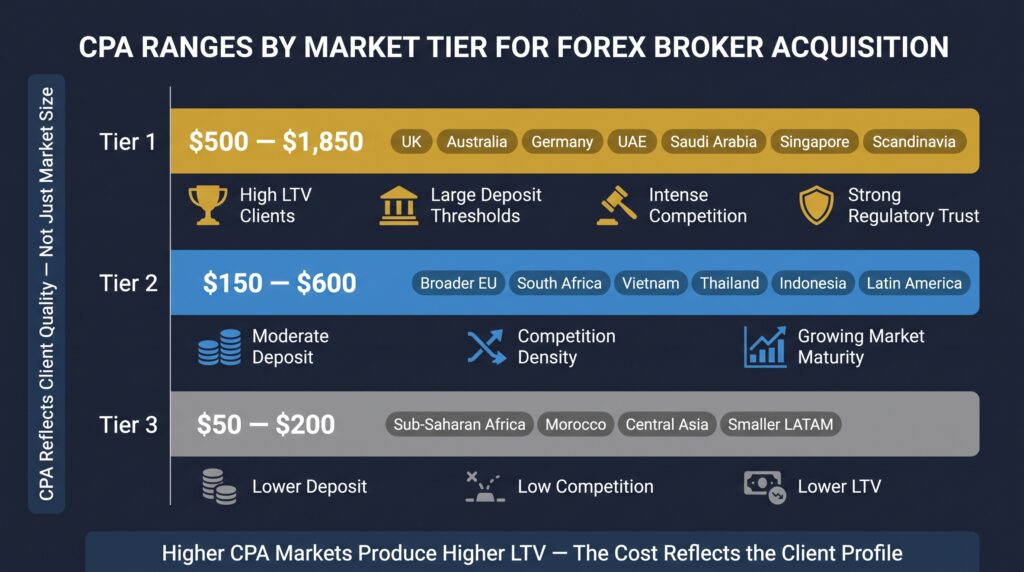
| Tier | Region Examples | CPA Range | Primary Drivers |
|---|---|---|---|
| Tier 1 | UK, Australia, Germany, UAE, Saudi Arabia, Kuwait, Qatar, Singapore, Scandinavia | $500–$1,850 | High LTV clients, large deposit thresholds, intense auction competition, strong regulatory trust signal |
| Tier 2 | Broader EU, South Africa, Vietnam, Thailand, Indonesia, parts of Latin America | $150–$600 | Moderate deposit thresholds, meaningful competitive density, growing market maturity |
| Tier 3 | Sub-Saharan Africa (ex-South Africa), Morocco, Central Asia, smaller LATAM markets | $50–$200 | Lower deposit thresholds, low competitive density, lower average LTV |
Premium affiliate programs in the highest-value Tier 1 segments have been reported as high as $1,850 — the upper bound reflects exceptional client profiles, not typical Tier 1 acquisition.
CPA as a Compliance Diagnostic Signal
Per the diagnostic principle established in the forex broker paid ads diagnostic guide, a direct acquisition CPA significantly below the regional benchmark is a signal worth investigating, not necessarily celebrating. It frequently indicates one of three issues:
- Non-compliant creative attracting lower-intent audiences responding to overclaimed promises rather than the actual product.
- GEO-targeting errors acquiring clients outside the intended high-value market, often at lower cost but also lower long-term value — see the geo-targeting strategy guide.
- Problematic ad placement inventory inconsistent with a regulated brand’s positioning.
Benchmark figures are what make this diagnostic signal usable in practice — without a credible regional reference point, ‘your CPA looks unusually low’ has no anchor to be meaningful against.
Platform-Specific CPA Variance Within the Same Region
| Campaign Type | Typical Intent Level | CPA vs Regional Benchmark | Compliance Constraint Level |
|---|---|---|---|
| Google Search | Highest — active query-driven | At or above benchmark | Medium — certification + copy restrictions |
| Google Performance Max | Mixed — algorithmically expanded | Variable, inflated until FTD data calibrates Smart Bidding | High — limited inventory control for regulated products |
| Google Display | Low — passive browsing | Well below benchmark per click, weak click-to-FTD conversion | Medium — risk warning prominence applies to banner creative |
| YouTube | Low-Medium — content consumption intent | Below Search, above Display | Medium — persistent risk warning required throughout video duration |
| Meta Feed / Stories | Medium — interest and behaviour-based | 20–40% below Search; more volume needed for same FTD outcome | Medium — financial products certification, per-creative review |
| TikTok In-Feed | Low — content discovery | Lowest CPA per click, weakest click-to-FTD conversion | Highest — format constraints, restricted in most regulated markets |
| Programmatic / DSP | Lowest — broad audience targeting | Cheapest clicks, rarely viable CPA per FTD for regulated brokers | Low-Medium — no platform-level compliance enforcement |
| App Campaigns (Google / Meta) | Mixed — app install intent | Not viable as primary acquisition channel for most regulated CFD brokers | Highest — platform certification plus App Store / Play Store financial app restrictions apply simultaneously |
CPA per click and CPA per FTD move in opposite directions across these campaign types — the cheapest clicks almost never produce the cheapest depositing clients.
Why CPA Has Risen Structurally Across the Industry
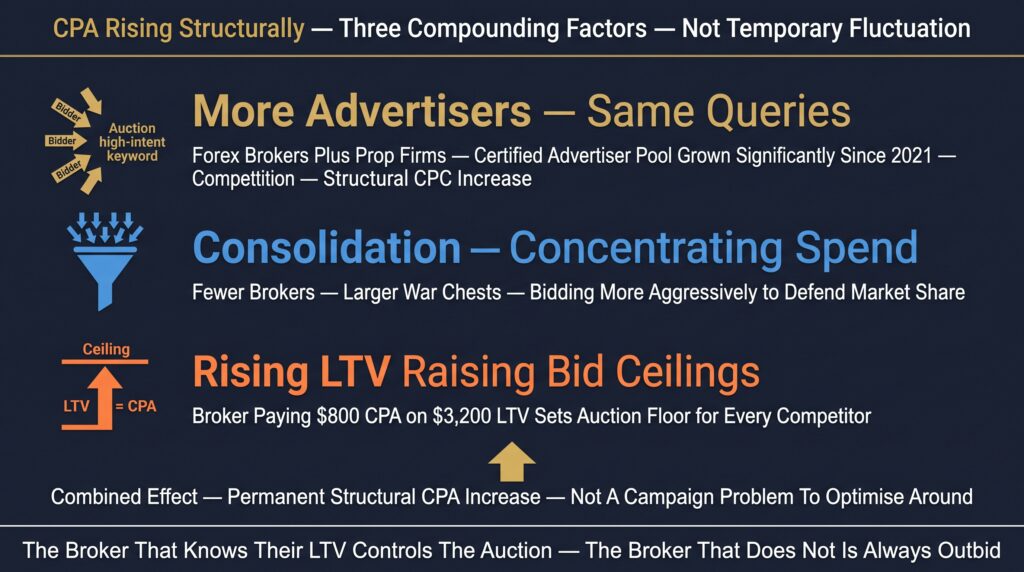
Forex broker CPA has risen meaningfully across most regions in recent years, driven by three structural factors rather than temporary fluctuation:
Forex broker CPA has risen structurally across most regions, driven by three compounding factors rather than temporary market fluctuation:
1. More advertisers competing for the same queries. The certified financial services advertising pool has grown significantly — more forex brokers entering markets where previously only a handful competed, compounded by prop firms whose explosive growth since 2021 has brought aggressive new bidders into overlapping keyword territory. More certified advertisers competing for the same high-intent queries drives structural CPC increases regardless of individual broker campaign quality.
2. Industry consolidation concentrating spend. Consolidation among tier 1 brokers has concentrated paid acquisition budgets among fewer, better-capitalised operators willing to bid more aggressively to defend market share. A broker that was a marginal auction participant three years ago is now a well-funded competitor with a war chest to match.
3. Rising lifetime values raising bid ceilings. As brokers in tier 1 markets have refined their LTV calculations — understanding what a depositing client is genuinely worth over 12, 24, and 36 months rather than at the point of first deposit — acquisition spend ceilings have risen industry-wide. A broker willing to pay $800 CPA because their data shows $3,200 average LTV per depositing client sets the auction floor for every broker competing in the same market.
Multi-year budget planning should account for this structural direction. A broker building next year’s acquisition budget on this year’s CPA figures risks underbudgeting as more certified advertisers enter the auction and established players continue raising their bid ceilings against improving LTV data.
CPA and FTD Quality — A Higher Number Is Not Automatically Worse
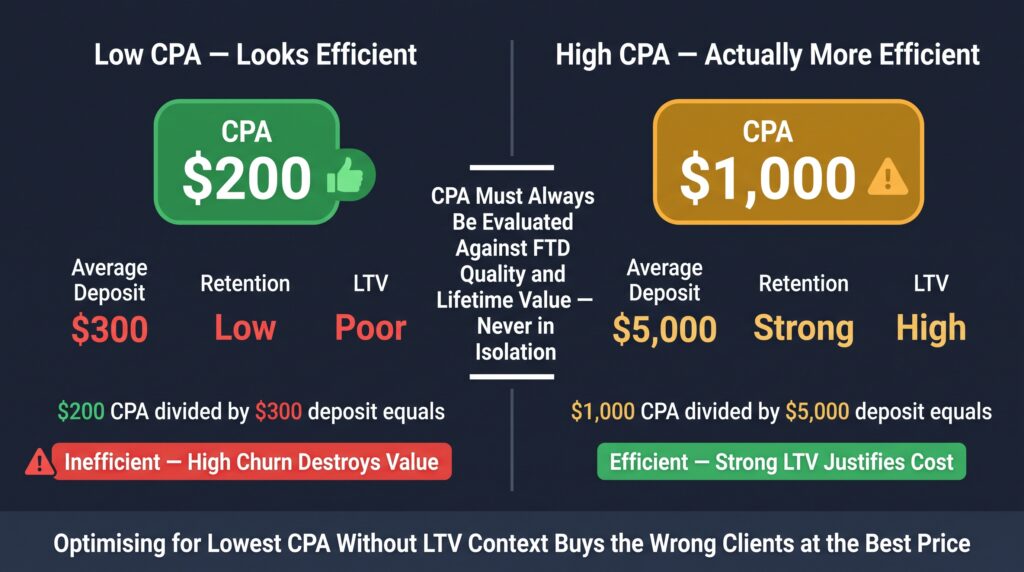
A higher CPA does not automatically indicate inefficiency — it often correlates with a higher-quality, higher-lifetime-value FTD, per the framework established in the FTD guide. A broker paying $1,000 CPA to acquire a client with a $5,000 average deposit and strong retention may be operating more efficiently than a broker paying $200 CPA for a client with a $300 average deposit and high early churn.
CPA should never be evaluated in isolation from the FTD quality and lifetime value it produces. A benchmark figure used without this context risks driving budget decisions purely toward whichever region or channel produces the lowest CPA, regardless of the long-term client value that CPA is actually buying.
Using the Benchmark in a Budget Planning Conversation
The regional CPA benchmark is most useful as an input to a specific planning conversation: given a target FTD volume for a specific region, what budget range should be allocated, and what variance from that expected range should trigger investigation rather than celebration?
A WORKED EXAMPLE
A broker targeting 50 FTDs per month in a Tier 1 market should expect to budget within the $25,000–$60,000 range based on the tier benchmark. Any campaign producing FTDs at dramatically below this range warrants the compliance diagnostic review described above before being treated as a performance win.
This transforms the benchmark from an interesting industry statistic into an operational planning tool a CMO can use directly when building or defending a budget proposal to leadership — grounded in a credible range rather than an arbitrary internal assumption.
If you want your actual CPA benchmarked against your specific region, platform mix, and FTD quality — not just a published industry range — that analysis is part of the paid diagnostic.
FAQ
Q1: What is the difference between affiliate CPA and direct paid acquisition CPA for forex brokers?
Affiliate payout CPA is the fixed commission a forex broker pays a partner, such as an affiliate or introducing broker, for each qualified client referred who completes registration and funds an account. This figure is typically published competitively by brokers to attract partners to their affiliate programs. Direct paid acquisition CPA is what the broker itself spends on its own advertising campaigns, such as Google Ads or Meta Ads, per client acquired through those direct channels, and this figure is almost never disclosed publicly by brokers. These two numbers are related because a broker will not pay an affiliate materially more than a client is actually worth to the business, meaning published affiliate CPA rates implicitly reveal something about the broker’s internal client valuation by region. However, the two figures are not identical, since affiliate CPA reflects a negotiated commission structure while direct acquisition CPA reflects real-time advertising auction dynamics that can differ from the affiliate rate at any given moment. Conflating the two when planning a paid acquisition budget produces estimates that may not match actual auction costs.
Q2: Why is published forex broker CPA data based on affiliate programs rather than direct spend?
Published forex broker CPA data is predominantly based on affiliate program payout figures because brokers publish these rates competitively to attract affiliates and introducing brokers, making the data publicly accessible, while direct paid acquisition spend per client is proprietary marketing data that brokers have no incentive to disclose publicly. Affiliate CPA data functions as a useful, though imperfect, proxy for direct acquisition cost benchmarking because a broker will not pay an affiliate materially more than a client is actually worth, meaning the published rate implicitly reflects the broker’s internal valuation ceiling for that client profile and region. This proxy relationship means published affiliate CPA figures can inform reasonable expectations for direct acquisition budget planning, but should be treated as directional ranges and patterns rather than precise, audited measurements of actual advertising platform spend, since affiliate program marketing materials have some inherent incentive toward presenting competitive, attractive headline figures.
Q3: What is the typical forex broker CPA range by region?
Forex broker CPA typically falls into three regional tiers. Tier 1 markets, including the United Kingdom, Australia, Germany, the UAE, Singapore, and Scandinavian countries, range from approximately $500 to $1,200 or more per acquisition, with premium programs reaching as high as $1,850, driven by higher average client deposit sizes, stronger regulatory trust environments increasing client lifetime value, and intense competition among well-capitalised regulated brokers in advertising auctions. Tier 2 markets, including broader European Union countries, South Africa, and parts of Latin America, typically range from $200 to $500, reflecting moderate deposit sizes and meaningful but less intense competitive density. Tier 3 or emerging markets, including parts of the Middle East and North Africa outside the UAE, Southeast Asia, and parts of Africa, typically range from $50 to $200, reflecting lower average deposits and lower competitive density in advertising auctions, though often with correspondingly lower regulatory trust signal value as well.
Q4: What does an unusually low forex broker paid acquisition CPA indicate?
An unusually low direct paid acquisition CPA relative to the regional benchmark for a forex broker is a signal that warrants investigation rather than automatic celebration as a performance win. It frequently indicates one of three underlying issues. The first is non-compliant ad creative making overclaimed promises about returns or trading conditions, which attracts high click volume from lower-intent audiences responding to the overclaim rather than the actual product, producing inflated registration numbers without corresponding funded account quality. The second is geographic targeting errors that result in the campaign acquiring clients outside the intended high-value market, often at a lower cost but with correspondingly lower long-term client value. The third is advertising placement inventory that is inconsistent with a regulated financial brand’s positioning. A campaign producing significantly below-benchmark CPA should be reviewed against these three possibilities before any budget increase is approved based on the apparently favourable cost figure.
Q5: Why has forex broker paid acquisition CPA increased over time?
Forex broker paid acquisition CPA has risen across most regions due to three structural factors rather than temporary fluctuation. First, increased Google Ads financial services certification scrutiny has reduced the number of qualified advertisers able to compete in the auction, which paradoxically increases the per-click cost for the certified brokers who remain eligible to advertise. Second, industry consolidation has concentrated paid acquisition spend among fewer, better-capitalised brokers willing to bid more aggressively for the same available inventory. Third, rising client lifetime values in Tier 1 markets have justified higher acquisition spend ceilings industry-wide, as brokers recalculate the long-term value of an acquired client and adjust their bidding strategy accordingly. These are structural trends rather than temporary fluctuations, meaning multi-year budget planning should account for continued upward pressure on CPA rather than assuming costs will revert to historical levels.
Q6: Does a higher forex broker CPA always mean less efficient marketing spend?
No. A higher cost per acquisition does not automatically indicate inefficient marketing spend, because CPA often correlates with the quality and lifetime value of the funded client it produces. A broker paying a higher CPA to acquire a client with a large average deposit and strong account retention may be operating more efficiently than a broker paying a much lower CPA to acquire a client with a small deposit and high early account churn. Cost per acquisition should never be evaluated in isolation from the funded account quality and lifetime value it produces, since a benchmark figure used without this context can drive budget decisions purely toward whichever region or advertising channel produces the lowest acquisition cost, regardless of the actual long-term client value that cost is delivering. Effective budget planning weighs CPA against client quality metrics together rather than treating cost minimisation as the sole optimisation target.